World Cities Data
This is a study of weather in cities around the globe, the gathering
of data, creation of charts, and analysis of the results. Geography
and remembering geography lessons from too many years ago played a
large part in the proper gathering of the data. To get a reasonable
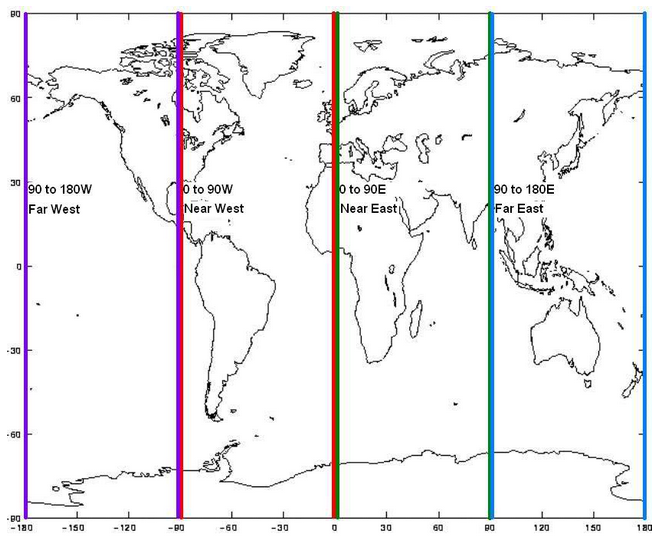
distribution of data points, I choose the method of dividing the
earth into quadrants using the image on the right. From the image,
I used the x-axis as latitude -180.0 to 180.0(Far West to Far East),
and the y-axis was -90.0 to 90.0.
The data gathering steps were as follows: one, the program uses a list of 4 tuples which were the ranges -180 to 180, and those are passed along with a constant tuple (-90,90) to two random.uniform functions which generated x and y coordinates. Two, the list of geo-coordinates are passed to a library called citipy which found the nearest city with a population greater than 500. Three, duplicates city, country records were deleted and the process was repeated until at least 500 cities are gathered. Four, with the city and country, the program makes requests to the Open Weather Map's API to gather the date, latitude, longitude, max temperature, humidity, cloudiness, and wind speed. The gathered data is then used to create the plots using matplotlib and seaborn modules.
CSV Data Converted to HTML
| City | Country | Date | Lat | Lng | Max Temperature | Humidity | Cloudiness | Wind Speed |
|---|---|---|---|---|---|---|---|---|
| Abeche | TD | 2017-09-08 13:40:20 | 20.83 | 13.83 | 72.99 | 83.0 | 24.0 | 3.4 |
| Abu Samrah | QA | 2017-09-08 13:00:00 | 55.58 | 24.25 | 91.4 | 33.0 | 0.0 | 4.7 |
| Acari | PE | 2017-09-08 13:40:21 | -74.62 | -15.43 | 66.69 | 54.0 | 8.0 | 2.95 |
| Adjumani | UG | 2017-09-08 13:40:21 | 31.79 | 3.38 | 68.04 | 96.0 | 68.0 | 3.74 |
| Agadir | MA | 2017-09-08 13:00:00 | -9.6 | 30.42 | 64.4 | 100.0 | 90.0 | 3.36 |
| Aguimes | ES | 2017-09-08 13:30:00 | -15.45 | 27.91 | 73.4 | 78.0 | 20.0 | 24.16 |
| Akdepe | TM | 2017-09-08 13:00:00 | 59.38 | 42.06 | 73.4 | 53.0 | 0.0 | 14.58 |
| Aksu | CN | 2017-09-08 13:40:22 | 80.26 | 41.12 | 53.28 | 67.0 | 8.0 | 6.53 |
| Alakurtti | RU | 2017-09-08 13:40:22 | 30.35 | 66.97 | 46.17 | 59.0 | 76.0 | 8.1 |
| Albany | AU | 2017-09-08 13:40:23 | 117.89 | -35.02 | 50.94 | 90.0 | 0.0 | 3.29 |
| Albert Town | JM | 2017-09-08 13:00:00 | -77.54 | 18.29 | 89.6 | 75.0 | 20.0 | 16.11 |
| Alcaniz | ES | 2017-09-08 13:40:23 | -0.13 | 41.05 | 57.78 | 87.0 | 0.0 | 3.18 |
| Alenquer | BR | 2017-09-08 13:00:00 | -54.74 | -1.94 | 89.6 | 62.0 | 20.0 | 9.17 |
| Alexandria | EG | 2017-09-08 13:00:00 | 29.96 | 31.22 | 78.8 | 61.0 | 40.0 | 10.29 |
| Alpena | US | 2017-09-08 13:15:00 | -83.43 | 45.06 | 60.8 | 48.0 | 20.0 | 10.29 |
| Alta Floresta | BR | 2017-09-08 13:40:24 | -56.09 | -9.88 | 99.18 | 20.0 | 0.0 | 3.62 |
| Altay | CN | 2017-09-08 13:40:25 | 88.12 | 47.87 | 26.19 | 87.0 | 8.0 | 2.62 |
| Alto Araguaia | BR | 2017-09-08 13:40:25 | -53.22 | -17.31 | 90.54 | 21.0 | 20.0 | 3.06 |
| Alvaraes | BR | 2017-09-08 13:00:00 | -64.8 | -3.22 | 89.6 | 62.0 | 20.0 | 4.7 |
| Amapa | BR | 2017-09-08 13:00:00 | -51.07 | 0.04 | 93.2 | 44.0 | 20.0 | 12.75 |
| Ambilobe | MG | 2017-09-08 13:40:26 | 49.05 | -13.2 | 71.46 | 69.0 | 8.0 | 12.01 |
| Amderma | RU | 2017-09-08 13:40:26 | 61.65 | 69.75 | 39.96 | 78.0 | 88.0 | 14.14 |
| Ampanihy | MG | 2017-09-08 13:40:32 | 44.75 | -24.7 | 65.79 | 54.0 | 0.0 | 5.97 |
| Ancud | CL | 2017-09-08 13:40:32 | -73.82 | -41.87 | 45.45 | 81.0 | 12.0 | 2.62 |
| Andapa | MG | 2017-09-08 13:40:33 | 49.65 | -14.65 | 62.64 | 97.0 | 92.0 | 2.84 |
| Antofagasta | CL | 2017-09-08 13:00:00 | -70.4 | -23.65 | 60.8 | 63.0 | 20.0 | 14.99 |
| Anzio | IT | 2017-09-08 12:55:00 | 12.62 | 41.49 | 68.0 | 88.0 | 0.0 | 4.7 |